Debugging Apache Cassandra in IntelliJ IDEA
Apache Cassandra is a highly scalable and distributed NoSQL database management system. It is designed to handle large amounts of data across multiple servers, providing high availability and fault tolerance. Cassandra is known for its ability to handle write-heavy workloads and its flexible data model, making it a popular choice for applications that require fast and reliable data storage.
By examining the Cassandra source code, developers can gain insights into the inner workings of the database management system and understand how it efficiently handles such massive volumes of data. Additionally, studying the code allows programmers to identify potential optimizations or areas for improvement, contributing to the ongoing development and enhancement of Cassandra. Ultimately, delving into the source code of Cassandra helps us expand our knowledge of distributed systems and strengthens our expertise in building robust and scalable applications.
So in today's article, I am going to show you how to debug Apache Cassandra in IntelliJ IDEA.
Clone Cassandra Git Repository
The source code for Cassandra can be obtained from the central Apache Git repository. Additionally, the Apache Software Foundation maintains a mirror at https://github.com/apache/cassandra. Since I generally find GitHub easier to use, I prefer to clone the project from the mirror.
Cloning is straightforward. Type in:
git clone https://github.com/apache/cassandra.gitAnd you'll get the following output:
Cloning into 'cassandra'...
remote: Enumerating objects: 392508, done.
remote: Counting objects: 100% (1884/1884), done.
remote: Compressing objects: 100% (757/757), done.
remote: Total 392508 (delta 845), reused 1703 (delta 800), pack-reused 390624
Receiving objects: 100% (392508/392508), 392.52 MiB | 5.90 MiB/s, done.
Resolving deltas: 100% (228721/228721), done.
With the project cloned locally, you can proceed and open Cassandra in IntelliJ IDEA.
Open Cassandra in IntelliJ IDEA
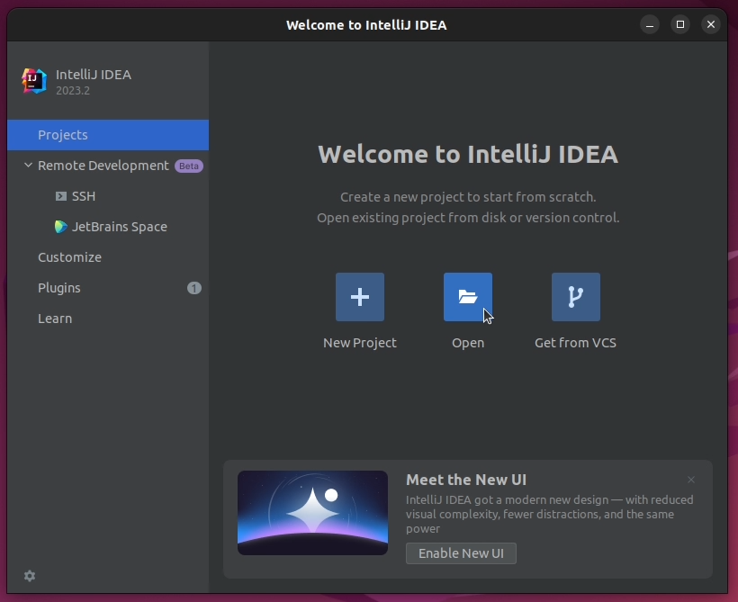
1. Launch IntelliJ IDEA and click "Open".
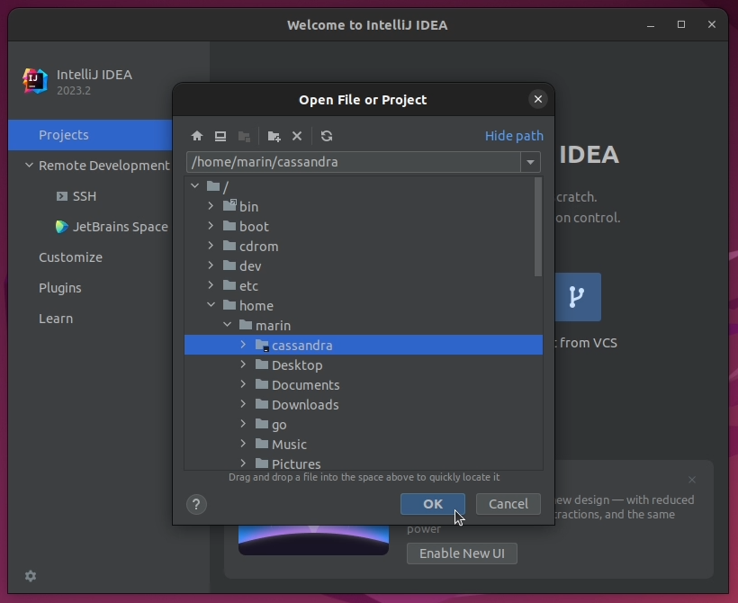
2. Locate the folder where Cassandra was downloaded and click "OK".
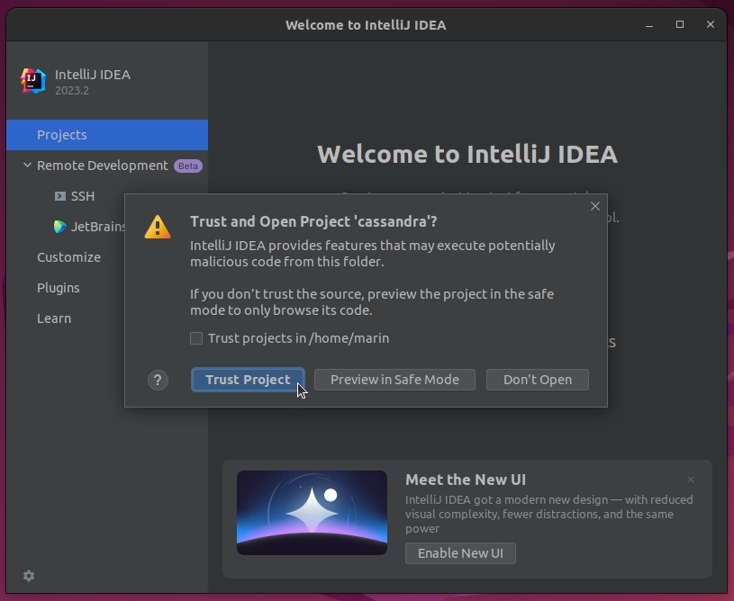
3. Click "Trust Project" if prompted to do so.
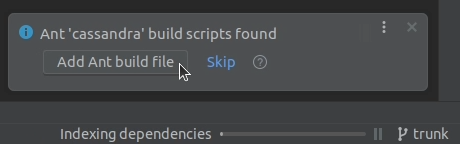
4. A popup will appear in the bottom right corner explaining that Ant build scripts have been found. Click "Add Ant build file".
5. From the list of Ant targets on the right, select and run generate-idea-files.
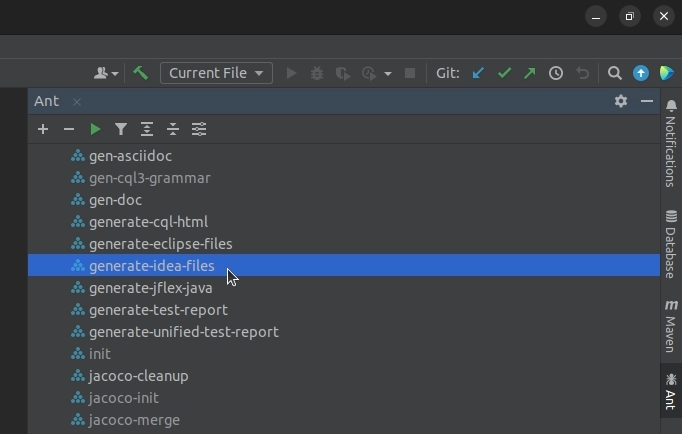
6. Wait for "Ant" to finish executing the target. A "Cassandra" run configuration should appear.
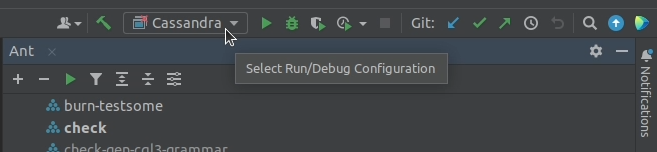
7. Sometimes you may get the following error for the newly shown run configuration:
Class 'org.apache.cassandra.service.CassandraDeamon' not found in module 'cassandra-dtest-shaded'In that situation, shut down IntelliJ IDEA. Then reopen the project and rerun the generate-idea-files target once more. This should start a re-indexing process in IntelliJ IDEA, and shortly after that, the run configuration should turn green.

You are now ready to start debugging Apache Cassandra in IntelliJ IDEA.
Debug Cassandra in IntelliJ IDEA
Now that we have the Cassandra project properly indexed in IntelliJ IDEA, we can go ahead and start a new debugging session.
I have been looking into the Memtable implementation lately, so I know that during startup Cassandra invokes the constructor of the SkipListMemtable class several times as it initializes the system keyspace. Therefore, I am going to go ahead and add a breakpoint to the constructor of the SkipListMemtable class, as I know for sure it will get invoked during startup.
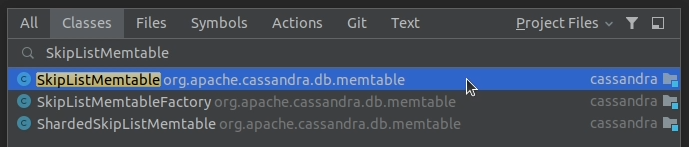
1. Find the SkipListMemtable class and open it up.
2. Find its constructor and add a breakpoint.
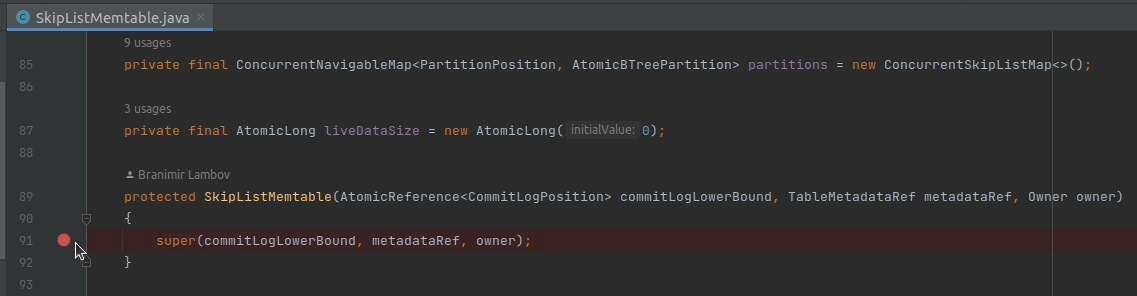
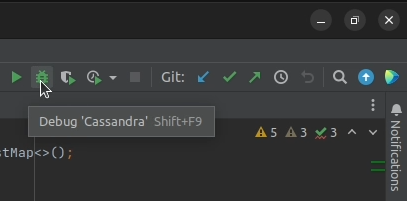
3. Click the "Debug" button to start a new debugging session.
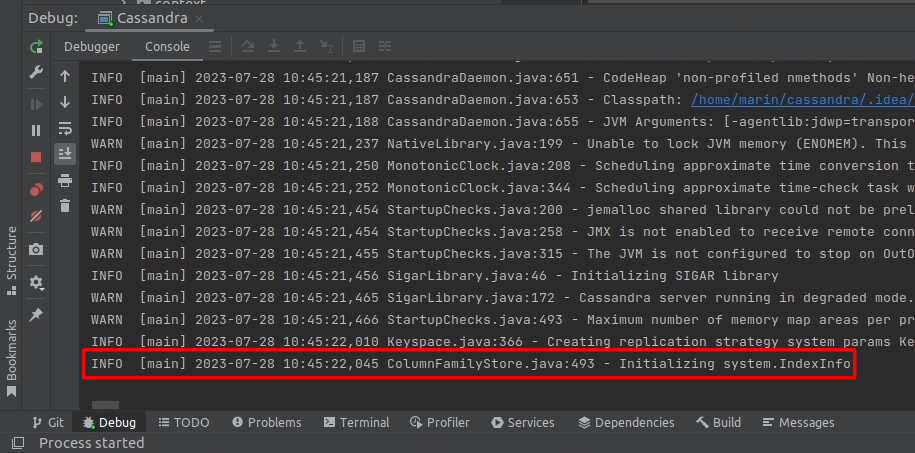
4. The project starts building, and shortly after that, a Console window appears indicating that the application is now running.
After a few dozen INFO messages, we see the following message:
INFO [main] 2023-07-28 10:45:22,045 ColumnFamilyStore.java:493 - Initializing system.IndexInfoThis message indicates that Cassandra has started initializing its system.IndexInfo keyspace.
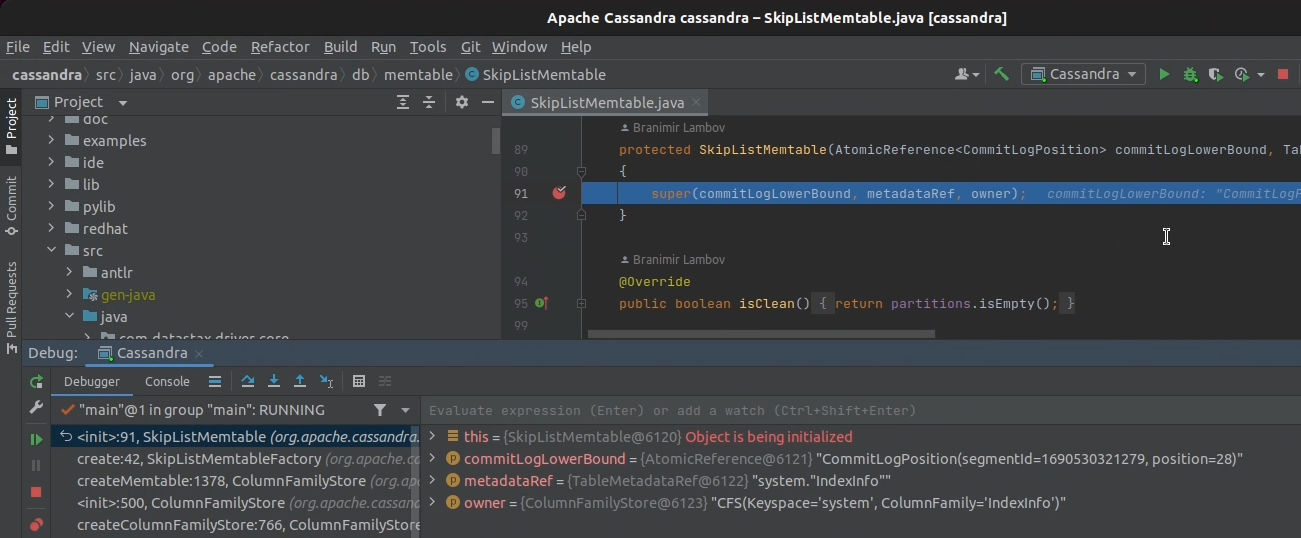
5. Almost immediately, program execution stops at our breakpoint, and we can start digging into the source code.
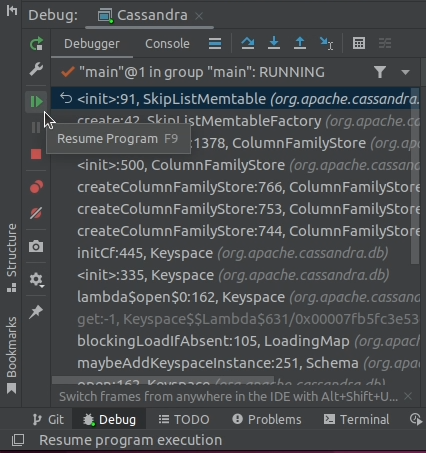
6. This confirms that our debugging session works. We can now remove the breakpoint and resume program execution.
Cassandra is now operational, and we can use a database client to connect to it and issue commands to try out debugging CQL statements.
Execute a Cassandra CQL Query
1. Open up a database client of your choice and connect to Cassandra. I personally favor DBeaver and you can read how to connect to your local Cassandra instance with DBeaver over here: https://www.cloudcentric.dev/setting-up-cassandra-jdbc-driver-in-dbeaver-community-edition/
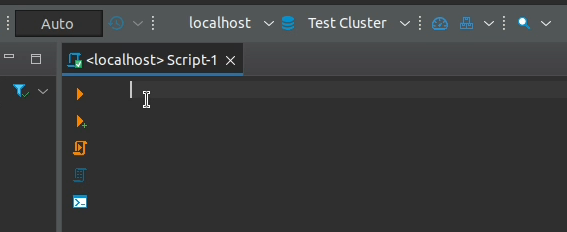
2. Paste the following CQL query into the SQL editor:
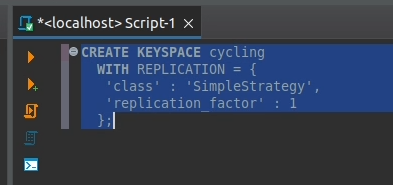
CREATE KEYSPACE cycling
WITH REPLICATION = {
'class' : 'SimpleStrategy',
'replication_factor' : 1
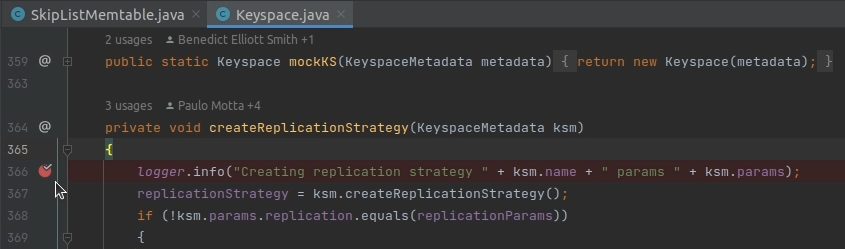
};3. Before executing the query, place another breakpoint in the createReplicationStrategy() method of the Keyspace.java class. I know for sure that this method will get invoked when we attempt to create the cycling keyspace with the query above.
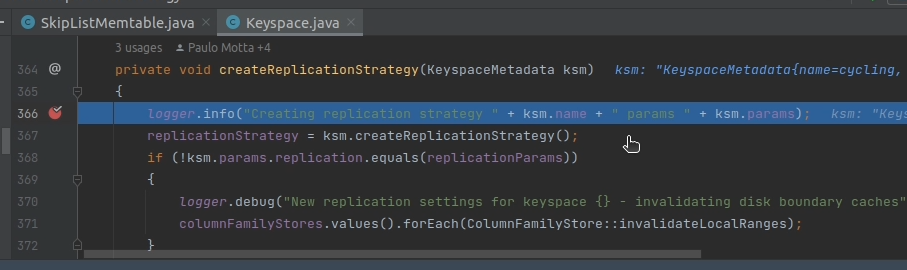
4. Execute the query
5. And sure enough execution stops at the breakpoint you added.
And there we have it: we are capable of debugging Cassandra locally and we can examine its source code with confidence and ease.
Examine Cassandra Data Folder
One last thing I'd like to show you is where Cassandra stores its data files locally. This information is useful, because you may decide that you want to start clean and completely erase any data that has been generated during previous debugging sessions.
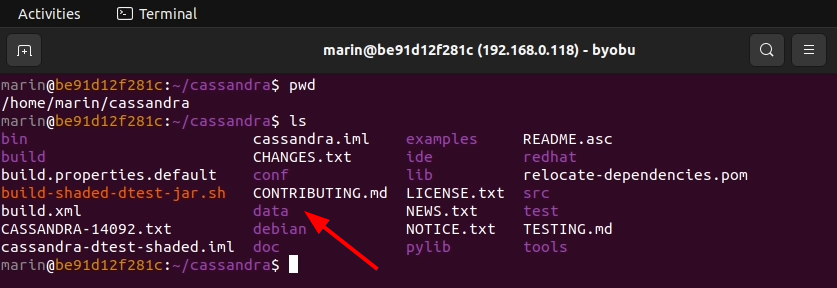
1. Navigate to the directory where you initially downloaded the Cassandra source code. If you issue an ls you will notice that there is a subfolder called data. The data folder doesn't originally exist in the upstream repository. Instead, it is created locally when you run the project for the first time.
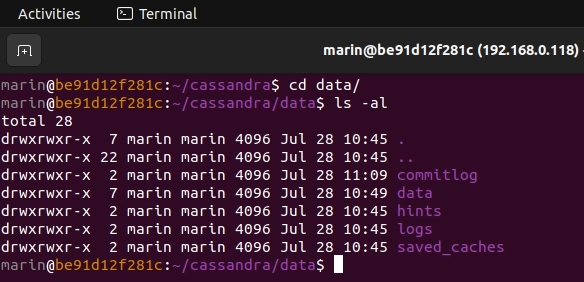
2. cd into the data folder to examine its contents. You will see several subfolders, where Cassandra persists its various data structures on disk.
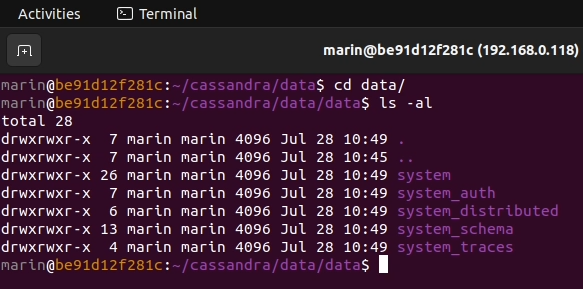
3. Navigate to the data subfolder. This is where the raw keyspace data is stored. You will, however, notice that the new cycling keyspace that we created previously is not listed here just yet. To get its contents flushed to disk, you need to go ahead and create a new table inside that keyspace.
4. Copy the following CQL query and execute it:
CREATE TABLE cycling.cyclist_name (
id UUID PRIMARY KEY,
lastname text,
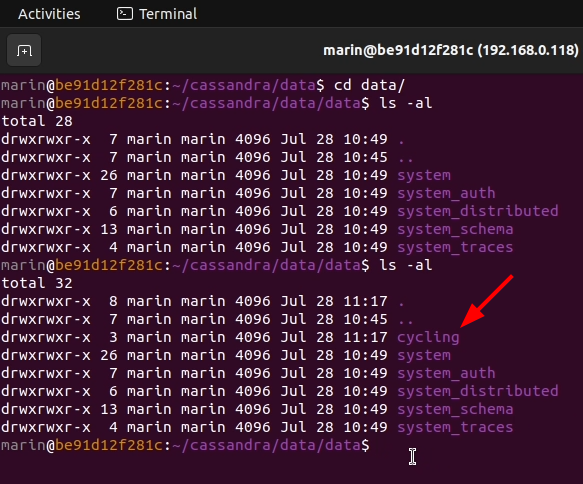
firstname text );5. List the contents of the data folder once again, and indeed, the data files for the cycling keyspace have appeared on disk.
That's it. You now know where the data files of your local Cassandra instance reside, and you are able to clean them up if necessary.
References
- https://github.com/apache/cassandra
- https://cassandra.apache.org/_/development/index.html#getting-the-source-code
- https://www.cloudcentric.dev/setting-up-cassandra-jdbc-driver-in-dbeaver-community-edition/
- https://docs.datastax.com/en/cql-oss/3.3/cql/cql_reference/cqlCreateKeyspace.html
- https://docs.datastax.com/en/cql-oss/3.3/cql/cql_reference/cqlCreateTable.html#cqlCreateTable